
There are a lot of technical tools that help determine important levels. Traders draw these levels through previous highs and lows, use Fibonacci retracements and pivot points, trend lines, etc. Important levels act as support and resistance for the price. The more times the price touches these levels, the more valid the level is confirmed to be.
When the price breaks an important level, that means that it will likely continue moving in that direction. However, not every breakout is real. In many cases, a price goes above an important level, but doesn’t manage to sustain this movement, returning to its previous trading range. This is a false breakout.
How can we know if a breakout is true or false?
It can be very difficult to say either way immediately after the price has crossed the given level.
Price patterns such as channels, triangles, and flags can be very valuable for identifying potential breakout points. The more important the level is, the harder it will be for a price to break it. Conversely, a real break at an important level will have more far-reaching consequences.
Trading false breakouts
There are more false breakouts than real ones. Novice traders tend to rush into breakout trades without real confirmation of a breakout, but are pushed out of the market by larger players.
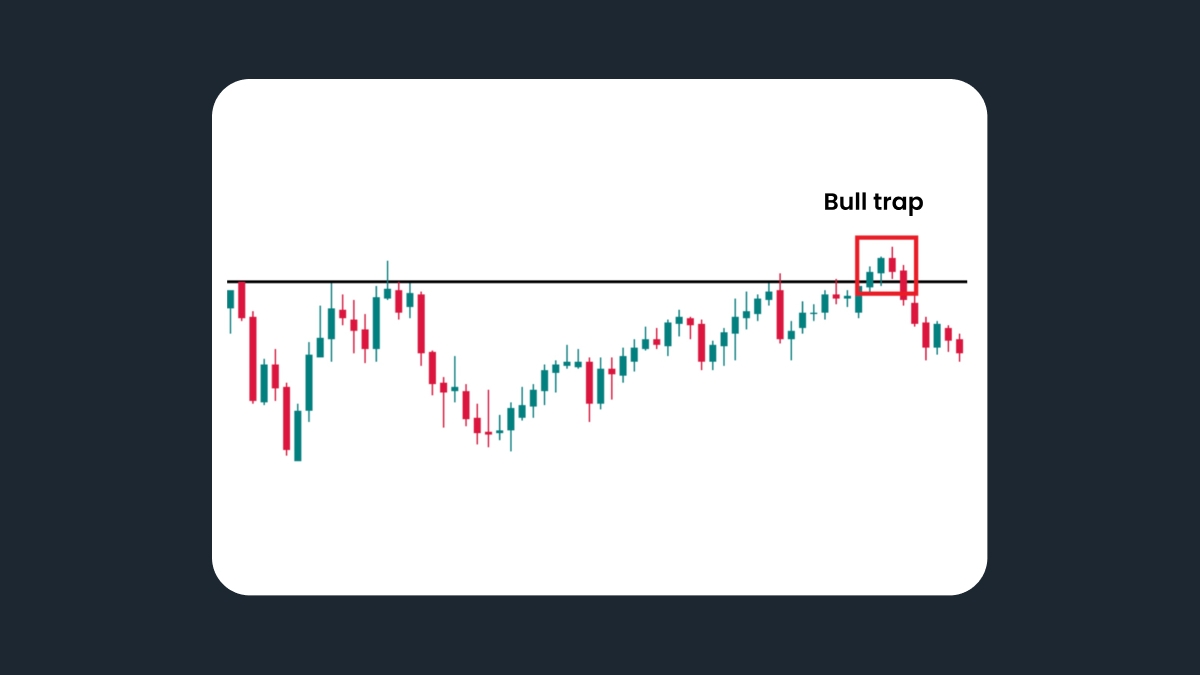
A false breakout may happen instantly after the price penetrates an important level, or after up to 4 candles beyond the level. The latter is referred to as a bull/bear trap. Reversal candlestick patterns in the vicinity of a potential breakout level give reliable hints that the breakout has failed.
False breakouts are best traded in the direction of the trend. We highly recommend analyzing H1 and higher timeframes, as (M30, M15, etc.) the price action is too chaotic at smaller ones.
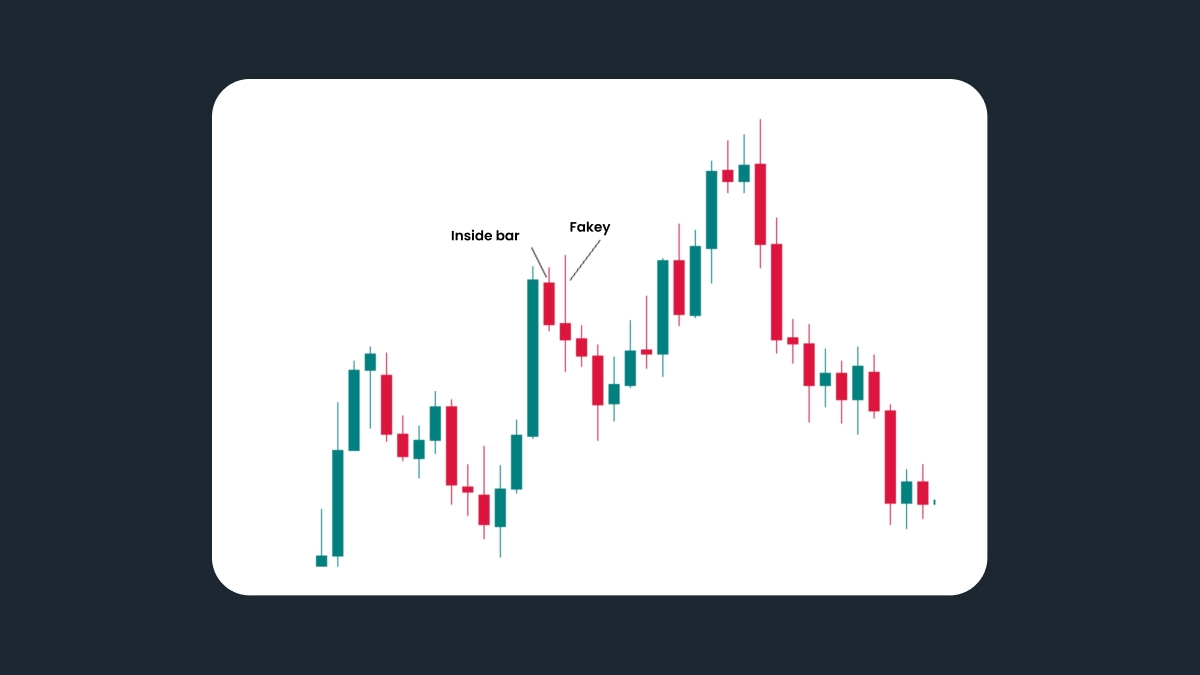
A particular case worth mentioning is the Fakey pattern or a false breakout of an inside bar. An inside bar is a candlestick that is completely covered by the previous candlestick. If you see an inside bar and then its breakout ends up in a pin bar candle, that’s a strong signal that the price will move in the direction opposite the false breakout.
Trading a real breakout
If you’ve decided to enter the market in the direction of a breakout, proceed cautiously. In many cases, simply putting a pending order, such as a sell stop a bit below the support level may trigger your entry order and then lead to a loss if the price goes back up.
To solve this problem, some players put entry orders for a short position below the breakout candle. Even so, the risk of a false breakout remains high.
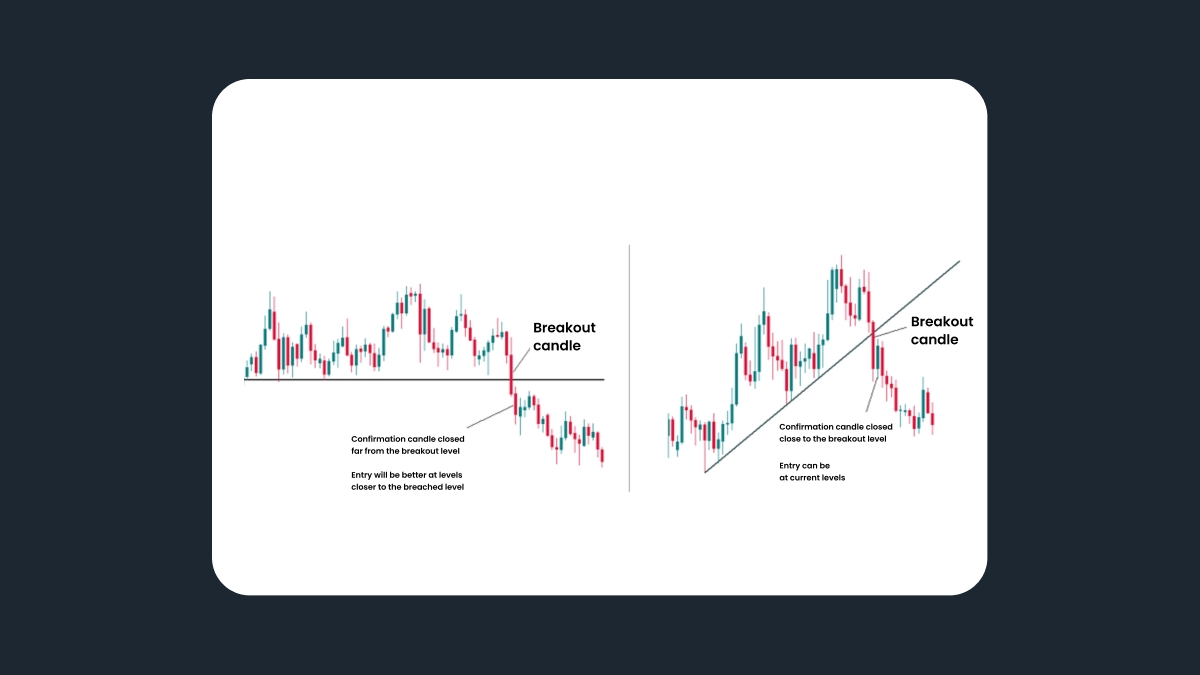
To enhance your chances of success, look at the breakout candle. Its length should exceed the average by at least 1.5 times. It should also have a full body (it can’t be a doji or a pin bar). Even if the candle fits this description and closes below the support level, wait for the second candle – the confirmation candle. It should be smaller than the breakout candle and close below the breakout level as well.
If the confirmation candle closes near the breakout level, you may enter at the market price. If the candle closes far from the breakout level, put a sell limit closer to the breakout level.
Patience is often the best option. In chart patterns like the Head and Shoulders, there’s often a retest of a broken level.
If you decide to trade on a breakout, you are taking a higher risk than in other scenarios. This higher risk should be reflected in your risk management: we recommend moving your stop-loss order to break-even level fast (i.e. move your stop-loss to a point where your trade will close with 0 loss faster than during range and trend trading). The risk/reward ratio can be up to 1:4 or 1:5. You may use scaling out (partially close the position as the price moves in your favor).
Don’t forget factors like market sentiment, economic news, and common sense. These things can help you make sense of what is happening on the chart.
Summary
Whether your breakout is real or false, confirmation should be your magic word. Real breakouts require more confirmations than false ones.